Monday Macro – a stellar November in the equity markets and more 2024 forecasts
Another spin through big institution 2024 predictions – which are surprisingly positive in my view. Plus, I update my asset allocation with an overweight for gold. And what a month November was for US
Another cracking month for US equities
Global equities weren’t too far behind
The 60/40 portfolio surged
Markets are betting on a big decrease in rates and the US avoiding a recession
Saxo Bank reckons RFK Jr will be the next president
Pictet thinks US equities will lag the rest of the world in 24
BoA reckons big rate cuts ahead
Deutsche Bank think US equities are NOT overvalued
I upgrade to overweight gold
Before I kick off my latest forecasts round-up, I wanted to draw attention to several stats and charts below – and update my asset allocation table.
Let’s start with November which was another bumper month for US equities in the S&P 500 benchmark index. Crucially though most other world markets also had a strong month. I’ve pulled out some highlights from the latest S&P Dow Jones Market Attributes report by Howard Silverblatt. For bears of US equities, this makes grim reading!
· The S&P 500 closed at 4,567.80, up 8.92% (9.13% with dividends), the best month since the 9.11% of July 2022. For the three-month period, the index was up 1.33% (1.74%), as the YTD return was up 18.97% (20.80%) and the one-year return was 11.95% (13.82%).
· Monthly intraday volatility (daily high/low) decreased to 0.75% from last month’s 1.28% and was 1.06% YTD.
· Historically, November has posted gains 61.1% of the time, with an average gain of 4.02% for the up months, a 4.16% average decrease for the down months, and an overall average gain of 0.88%. For November 2023, the market was up 8.92%
· The S&P Global BMI reversed course and posted broad gains, as November added 9.05%, compared to October’s decline of 3.44% and September’s 4.29% decline. Global markets were up 8.87% without the U.S.’s 9.18% gain, compared to being down 4.41% without the U.S.’s 2.78% decline in October
· As for valuations, based on estimates for the earnings up to 30th September 2023, and using operating earnings the S&P 500 is currently valued at 18.92 times earnings which drops to 18.37 based on estimates to the end of the year. If we use as reported earnings those respective PEs increase to 21.42 times and 20.41 times earnings.
The quant team at SocGen also has a typically sanguine take on the excitement in the markets:
· November was a terrific month for most assets, with prices surging across the board. The global 60/40 portfolio as calculated by Bloomberg surged 7.64%, its best monthly performance since the announcement of the COVID vaccine in November 2020. This helped push this index into a very healthy 11.5% ytd gain. The MSCI World, including its gains on Friday, is now just down 3.9% ytd.
· The strength and uniformity of the rally suggest top-down over bottom-up repositioning. Yes, the low-beta sectors outperformed, and Energy was a notable laggard, but most global sectors gained by 7-10% during the month and equity factor performance was extremely muted.
· Spurring this move was a big drop in bond yields and interest rate expectations. However, to put this into context, the US 10-year bond yield may have declined 75bp in just six weeks, but this simply erases the rises seen in the six months prior, and implied rate cuts are back to where they were at the end of the summer. From where we are sitting, the market remains clueless about where 10-year bond yields or interest rates should be right now.
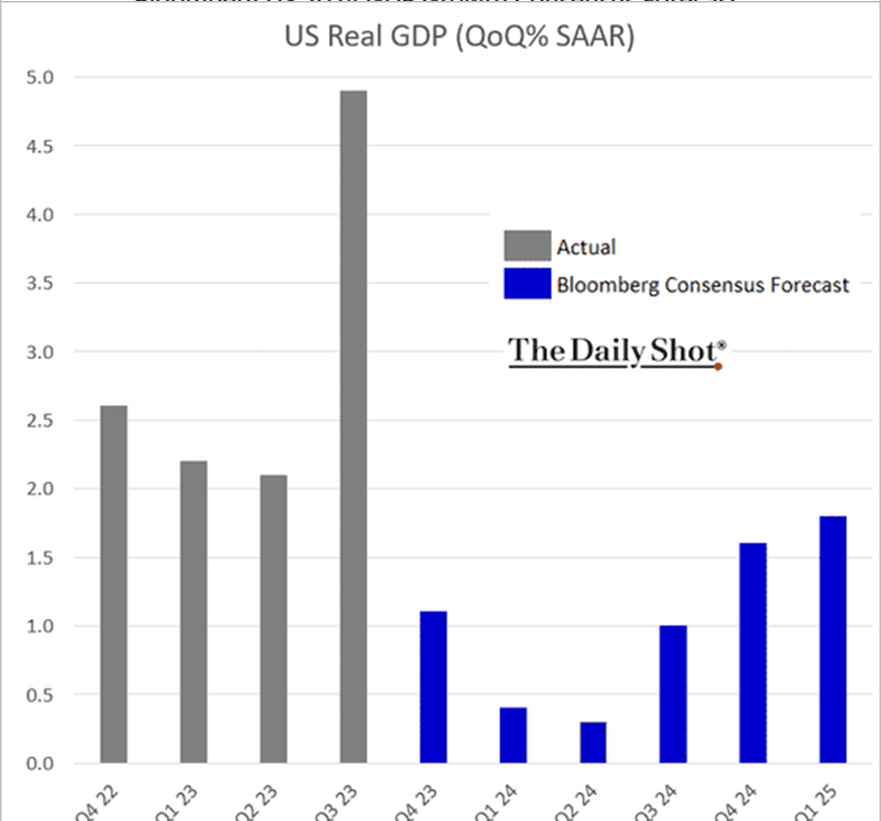
The two charts below from The Daily Shot sum up why I think investors got SO excited in November. The first shows that economists upgraded their forecasts for next year’s GDP growth in the US.
The second chart suggests that no recession is expected over the next few quarters.
I’m much more pessimistic than this but then again I’ve been wrong about the US economy for all of 2023.
Next week I’ll be scoring my early January predictions for 2023 – I suspect I won’t have much to boast about given how over-bearish I have been so far.
Keep reading with a 7-day free trial
Subscribe to David Stevenson's Adventurous Investor Newsletter to keep reading this post and get 7 days of free access to the full post archives.


