


What next for EM equities? Adventurous Investor in Conversation with Carlos Hardenberg of the Mobius Investment Trust
I’ve been keen to talk to someone in the know about the state of emerging market equities for ages. On paper, all the macro factors spell doom and devastation: strong dollar, high inflation, restive populations, China, and of course ever more expensive debt.
My core view is that active managers have a really tough time at the top-down, macro-level working out how to invest on a country-by-country basis. Precisely because geopolitics plays such a large unpredictable role I sense that active managers are on to a hiding trying to second guess what President Xi or PM Modi will do next.
In that case, I can see why beating the index is a hard task and why some managers - notably Fundsmith - might give up. But once we descend down into mid and especially small caps, the game changes. Sure, country allocation matters, but you can afford to see past this big-picture stuff and just pick the most interesting businesses, even if they are in ‘unpleasant’ geographies. Another plus for active stockpickers is that the passive funds in the EM space are still heavily weighted towards Greater China (China, HK and close trading partners like Taiwan and South Korea) while active managers can diverge dramatically from this China exposure - which is certainly true for the Mobius Fund.
Anyway, yesterday I caught up with Carlos Hardenberg from Mobius to talk EM equities and it makes for a fascinating conversation. Well worth a listen….Click on the play button above!
A misunderstood fund: Riverstone Credit Opportunities
Over the last few years, we’ve seen a profusion of god-awful terms used to describe an attempt to make investing more ‘sustainable’. There’s the dreaded ESG which is largely a data-driven process of scoring and filtering, and then there’s sustainability itself which I understand to be a broader term used to describe a corporate approach to a more long-term approach to thinking about a corporates environmental footprint.
And then there’s impact where you define a particular objective - say reducing carbon emissions or building energy storage - and then invest to achieve that direct impact. To be clear, many of these terms have some overlap but there’s also the very real possibility that you might invest in a company with a fabulous specific impact - say selling electric cars - which has dreadful union relations, poor ESG scores (especially around the S bit) and represents the very epitome of an unsustainable business model over the ultra-long term.
This massive confusion has caught lots of companies and funds in a real bind - are they sustainable, impactful, or ESG-focused?
I’d humbly suggest that the Riverstone Credit Opportunities Income fund is caught in this trap of investment language, made doubly worse by a misperception in the market. First that misperception - I’d long assumed that the Riverstone Credit fund lends money to businesses in the hydrocarbon economy, especially in North America. That’s clearly a big no no for many investors, especially in the ESG space.
But after talking to the managers behind the fund, it emerges that that perception isn’t actually true. In fact, one could argue that if you care about impact investing, then an investment in the fund could actually make sense. How so? Because, put simply, most of its current loan book consists of either ‘green’ loans or loans’ designed to make a legacy industry more ‘sustainable’.
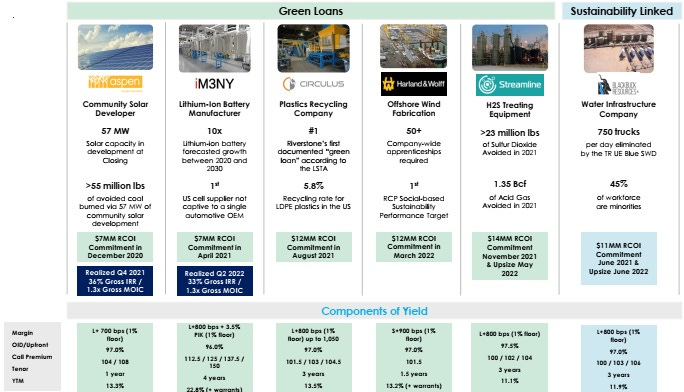
The two charts below I would argue flesh this point out. The first shows the most recent loan activity on a loan-by-loan basis. The green emphasis is obvious - battery manufacture, solar development, plastics recycling, wind turbine fabrication, and reducing SO2 emissions. There’s also a sustainability-linked loan - the bad bit of which is that the business makes money from unconventional energy companies which use copious amounts of water in the production process. The good bit is that the water company is trying to reduce water usage.
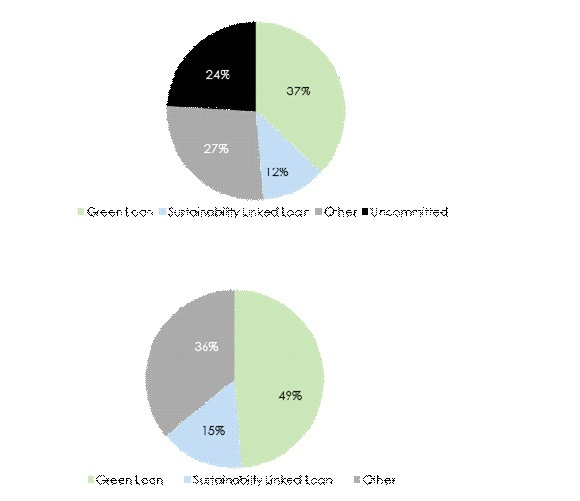
The second chart shows the overall portfolio mix. Green and sustainability-linked loans (which may have some link to the hydrocarbon economy) comprise just under two-thirds of the loan book.
Now some of those loans in the sustainability bucket are, as I said, linked to the hydrocarbon economy. I happen to think that it is worth investing in businesses that make these legacy industries more sustainable -- that is a clear plus for impact investing. But one can also argue that these sustainability-linked loans fail most ESG tests and that the borrowers themselves are not, corporately, sustainable over the long term as the industry they rely on will eventually fade away (it’s argued). Also, it is worth noting that just over a third of the loan book is still lent to businesses within the traditional hydrocarbon economy.
So, where does this leave the fund using my trinity of terms? I think it is having an impact but it’s clearly got some negatives on traditional ESG scores. Your guess is as good as mine but I would argue strongly that it’s unfair to typecast the fund as a lender to the hydrocarbon economy - its clearly moved well away from that model.
Having got that perception bit out of the way, let’s get to the investment argument. A couple of weeks ago I suggested buying BioPharma Credit because it ticked some key boxes :
- It produces an income yield whichis very generous even in an era of higher interest rates. The dividend yield on offer is well in excess of any likely endpoint for the yield on risk free assets.i.e well in excess of 6%.
- It has a track record of getting repaid. Remember, the easy part is lending money, the difficult part is getting that money back. BioPharma has an excellent track record in that part
- It lends money at high rates to borrowers who can usually afford the debt because its cheaper than equity
- Last but by no means least, most loans are floating rate and senior secured with early repayment penalties attached
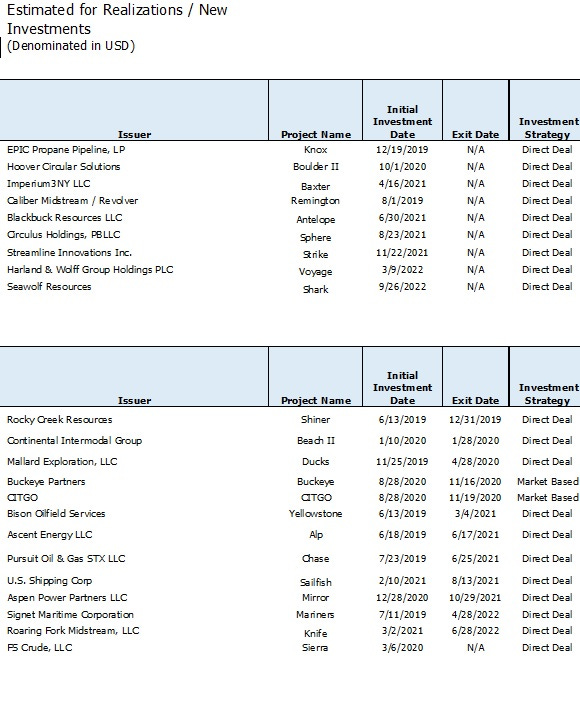
Rverstone Credit also passes these tests. The management firm behind the fund has lent out $2.3 billion in 55 transactions to date and the loss rate over all those years is in the single digits. In the fund itself, there has only been one small loss out of more than 20 loans. In fact, many loans - as with BioPharma - have been repaid early. The two big tables below show the realization track record of the fund.
Basic Facts : Riverstone Credit Opportunities Income PLC
· Ticker: RCOI
· Target yield around 7 to 8c
· Managers : Riverstone Credit Partners - have invested $2.3 billion in 55 transactions to date
· RCOI’s target unlevered 15% gross IRR - 18.8% IRR on realized investments
· NAV : $1.02
· RCOI paid $1.7 cents for Q4 2021 and $2.0 cents for Q1 2022
· Current Discount - 16%
· Average duration of loans: 2.8 years
· Gross yield on loan from initial investment 12.3%
· 100% secured loan book all floating rate
As I write this, the shares are trading at around $0.81 a share against a NAV of $1.02. The shares have paid a quarterly dividend of 2c for the last two quarters and I think it looks like the fund will carry on paying at that level for the rest of the year. Even if we assume a lower dividend of around 7c a year (a rate that was paid in previous years) then the net yield is 8.6%, whereas if the dividend hits 8c a year (possible in 22) that’s a net yield of 9.8%.
Also, being a tad cynical here, the fund is sub scale with a market cap below $100m. The fund has been busy buying shares but one has to wonder whether the message I mentioned earlier - this is not a legacy hydrocarbon lending fund - is getting through. That raises the possibility that at some stage, unless the managers can raise fresh capital, they might be tempted to close the fund and then slowly run off the book and close down the fund. If that were to happen, there’s a good chance that investors would get closer to NAV on the wind down, minus the inevitable last-minute stings in the tail as the loan book is run down. Given the 20% plus discount though those stings in the tail are probably manageable. My own hope is that the fund actually grows in size, especially after the managers have re-educated the market to the idea that this fund is actually an impact-focused lending fund.
There are some very obvious risks with this fund - I’d highlight the following:
- Currency risk if the dollar weakens
- Liquidity risk, in that the shares aren’t heavily traded and it’s a fund on the specialist fund segment of the market
- A recession and increased rates might push some borrowers into losses and trigger credit defaults
- Energy prices might tumble in a recession hitting the borrowers in the loan book, especially in the legacy hydrocarbon positions
I wouldn’t want to underplay any of these risks, but I think they are in the share price already. In the meantime, you might pick up some discount tightening and that dividend yield.
One last side note - a transaction from just yesterday highlights the fund’s strengths. It fully exited a green loan to a company called Circulus for an IRR of 16.6%. RCOI originally committed $12.5m (15% of invested NAV as of 30 June 2022) in August 2021 to finance the production of recycled plastics packaging. Circulus refinanced this loan with a different lender. The bad news is that this is a big repayment and thus the fund has a lot of cash on its balance sheet again (a similar challenge for BioPharma). If that cash isn’t reinvested soon, that could drag down the dividend cover. That said, the funds managers seem very confident of the pipeline for new loans especially as the higher interest rate environment is generating more demand for their product. And remember that as the loans are floating rate, the yield is going up.
Infrastructure, Renewables, tax and interest rate increases
The big story in funds land in the UK has been the dramatic repricing of risk in the infrastructure and renewables space. An unholy trinity of factors has come together to maximize uncertainty. There’s the obvious issue of inflation (probably a net plus for many funds), which has prompted increased rates, which in turn will result in increased discount rates (a net loss). All of this has been in part a result of increased energy prices (a plus) which has now brought the threat of windfall taxes in its wake (a net loss).
My guess is that these factors will all come out in the wash and we’ll probably end up roughly back to where we were minus the large premiums. As I discussed in a recent Citywire column, the emphasis will now be to focus on funds that generate NAV growth rather than look and feel a bit like bond surrogates which really only ever pay a boring 4 to 5% dividend yield.
But that still leaves lots of unanswered questions, not least whether the market has overreacted in pushing lots of very credible, successful funds into deep discounts. Luckily plenty of talented fund analysts have been weighing into this debate in recent days, so much so that I thought I would highlight some of the most interesting recent comments.
Let’s start with the looming threat of windfall taxes or caps on renewable energy prices. Personally, I think the government is crazy not to levy windfall taxes on the whole energy sector, renewable or otherwise, but fairly and equally. Let’s be honest, even many industry executives think a windfall tax makes sense!
The rumor mill suggests a price cap is coming, which I think is the less favorable option, as it sends the wrong price signals, but hey what do I know? Matt Hose, funds analyst at Jefferies has been doing the sums on a price cap and come to the following conclusion on NAV impact for renewable funds:
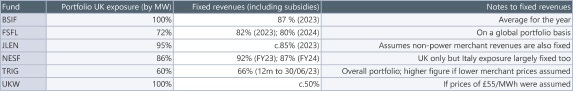
“ Although capped prices of £50-£60/MWh would be close to those captured by the funds pre-2021, they would still entail material downside to near-term cash flow assumptions. This is particularly for the 2022-2025 period, where the forward curve is used, after which the assumptions revert to around £50/MWh (real) anyway under consultants' forecasts. As such, the degree of downside to NAVs would be contingent on the price/duration of the cap, the extent of near-term fixing/hedging arrangements, and the current 'haircut' taken to the forward curve. If we very crudely remove the portfolio valuation increases taken over the previous four quarters due to the higher forward curve, we estimate a NAV impact (before any offsetting factors) of 10-15% for UKW, and 5-10% for TRIG, remembering the latter is only 60% exposed to the GB market. The impact for solar funds BSIF, FSFL and NESF, would be considerably less than this though, given a high degree of PPA fixing”.
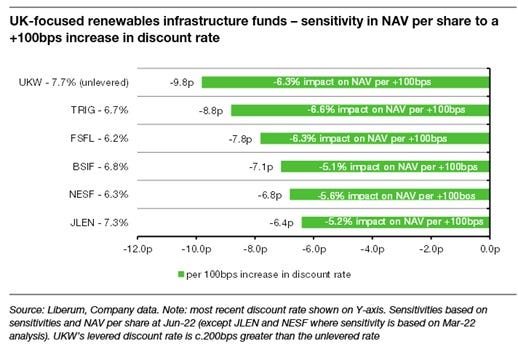
Next up we have the impact of rising interest rates and the inevitable re-pricing of risk via increased discount rates. According to the funds team at Liberum:
“Discount rates will inevitably increase from Q3 and the extent to which these are raised will have a significant impact on NAV per share. On average (in isolation), as displayed in the table below, a 1ppt increase in discount rates would have a -5.9% impact on NAV per share, when viewed in isolation. The sensitivities are as at Jun-22 (JLEN and NESF as at Mar-22).”
Looking at the table below, the biggest impact would seem to be on UKW and TRIG with JLEN the least impacted.
What about the core infrastructure (non renewables) funds tasked with providing a stable, inflation-linked return from a diversified portfolio of public/private assets?
The attractions ate obvious - a yield of between 4.5 and 5%, a great 15-year track record, and a record of progressively increasing their dividend payouts. The downside is that these core funds have traded at whopping premiums in the past and have diversified away from really boring PFI projects to riskier projects with more economic exposure.
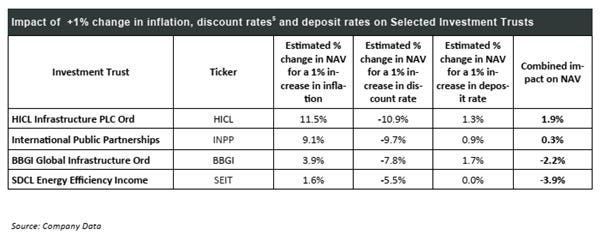
Killik and Co’s fund analyst Mick Gilligan has been running the numbers and thinks that both INPP and HICL are still worth investing in despite all the worries about rising interest rates and higher discount rates. More to the point, he thinks both are still great hedges on rising inflation.
Gilligan makes the important point that we need to see all the moving parts of the valuation mix for a fund: yes, higher interest rates will push down valuations, but higher inflation will also make those income-producing, RPI-linked assets more valuable. However, as Gilligan points out, “the market tends to adjust share prices quickly for the discount rate element of the NAV calculation but be slow to readjust for any inflation related benefits. “
“HICL provides strong inflation linkage and low correlation to wider equity markets. In the 12‐month period to its last financial year end (31/3/22) the portfolio demonstrated a 0.8x inflation correlation (i.e., a 0.8% rise in portfolio value for every 1% rise in inflation above HICL’s long term assumptions which are currently 5.25% in the UK this year, falling to 2% for 2030 onwards) and a 0.36 beta against the FTSE All Share Index (i.e., a rise or fall of 0.36% for every 1.00% rise or fall in the UK stock market). The inflation linkage helps to protect against a higher interest rate environment caused by persistently high inflation.
“INPP - The largest portfolio allocation (39%) is to Public‐Private Partnerships (PPP). The majority of these are availability‐based assets, meaning that International Public Partnerships receives contractual payments if the facilities are available for use. The contracts are usually structured with annual inflationary increases. The portfolio also holds several regulated assets across Energy Transmission, Gas Distribution and Wastewater. These are generally monopolies with returns determined by a regulator, which takes account of inflation. INPP has an excellent record of dividend increases. It has increased its dividend every year for the last 13 consecutive years. It also offers high inflation linkage at 0.70x (i.e., an increase of 0.7% in portfolio value for every 1% rise in inflation above INPP’s long term assumptions which are currently 2.75% in UK RPI”
The table below from Killik highlights the funds with inflation-protecting qualities such as BBGI Global Infrastructure (BBGI), SDCL Energy Efficiency Income (SEIT) and Capital Gearing Trust (CGT).


Investment Ideas - small cap EM equities with Mobius, a misunderstood income play and how to value infrastructure/renewable funds